Problem
What made this hard
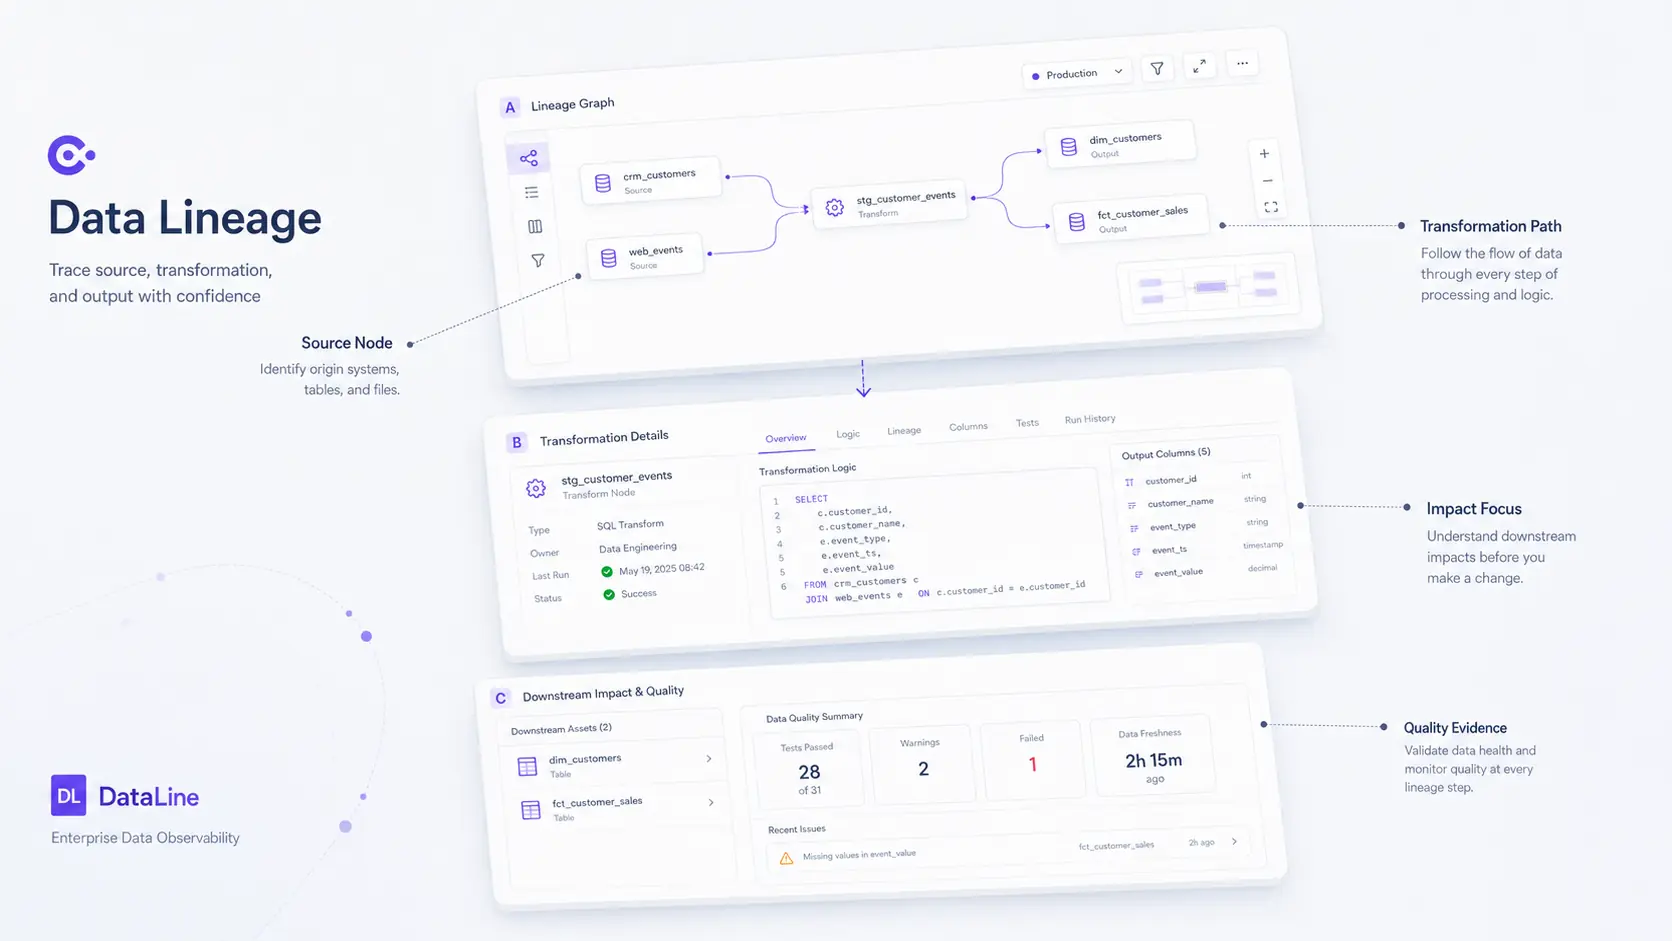
When a metric looked wrong, people struggled to find its source, transformations, and downstream effect. Large dependency graphs quickly became unreadable.


Data intelligence · Enterprise SaaS · 2022
Trace a metric from source to business impact.
Problem
When a metric looked wrong, people struggled to find its source, transformations, and downstream effect. Large dependency graphs quickly became unreadable.
Outcome
A progressive exploration model that pairs an overview graph with focused paths, node details, and impact analysis.
The thesis
Case-study proof
Enough context to judge the choice, inspect the work, and separate evidence from ambition.
Why this, not that
I used progressive graph exploration instead of displaying the entire dependency network at once. A complete graph preserved every relationship but made investigation unreadable; a focused neighbourhood kept the selected metric and its immediate path understandable.
Why this case is specific
The interaction was designed for PowerMe lineage work: tracing a metric from source data, through transformations, into downstream business outputs while keeping impact beside the selected node.
What you can inspect
Shipped interaction model · illustrative reconstructionThe case explains the shipped interaction model and shows an illustrative reconstruction of the focus-path behaviour. It does not present the reconstruction as a production screenshot.
Decision to outcome
Progressive disclosure made source tracing, node inspection, and downstream impact part of one investigation path. The supported outcome is the shipped workflow; no reduction in investigation time is claimed.
Interface evidence
The first job was controlling complexity. The default view shows meaningful relationships. Filters and focus states reveal depth only when a person asks for it.
Selecting a node opens details and highlights the immediate path before and after it.
01 / Model
The first job was controlling complexity. The default view shows meaningful relationships. Filters and focus states reveal depth only when a person asks for it.
02 / Explore
Selecting a node opens details and highlights the immediate path before and after it.
03 / Decision
Labels, edge weight, and node categories support scanning. The graph helps orientation. The detail panel supports action.
04 / Impact
The shared model helped analysts and administrators investigate origin, explain issues, and understand the effect of a change before making it.
Supporting evidence
Labels, edge weight, and node categories support scanning. The graph helps orientation. The detail panel supports action.
The shared model helped analysts and administrators investigate origin, explain issues, and understand the effect of a change before making it.
Bring me the difficult part.
Complex workflows, AI trust, and enterprise systems.
Discuss a product challenge